Strategy
Repricing Flow Strategy
Repricing Flow is a Systematic Equity Long/Short strategy designed to outperform SPY in unhedged GBP terms by owning liquid US, UK and European equities undergoing slow institutional repricing, while using short index exposure and downside overlays to manage market drawdown rather than fully neutralise beta.
The strategy targets companies where fundamental improvement is confirmed by price action, but where large investors typically adjust exposure gradually because of liquidity, benchmark, mandate, and career-risk constraints. The objective is not market neutrality. The objective is upgraded equity participation: retain exposure to the equity-risk engine, but replace passive index ownership with a diversified, capped stock-selection book, explicit cost and liquidity discipline, and defined downside protection.
The current standalone research specification, from 2 January 2020 to 2 June 2026, returns 19.4% annualised versus 14.6% for SPY GBP, with Sharpe 2.06 versus 0.76 and max drawdown of -8.8% versus -25.8%. These results are research/backtest evidence, not a standalone audited fund track record.
Implementation spectrum
Best Sharpe, risk-tight, and conservative variants
| Role | Annualised return | Volatility | Sharpe | Max drawdown | Latest beta | Turnover | Notes |
|---|---|---|---|---|---|---|---|
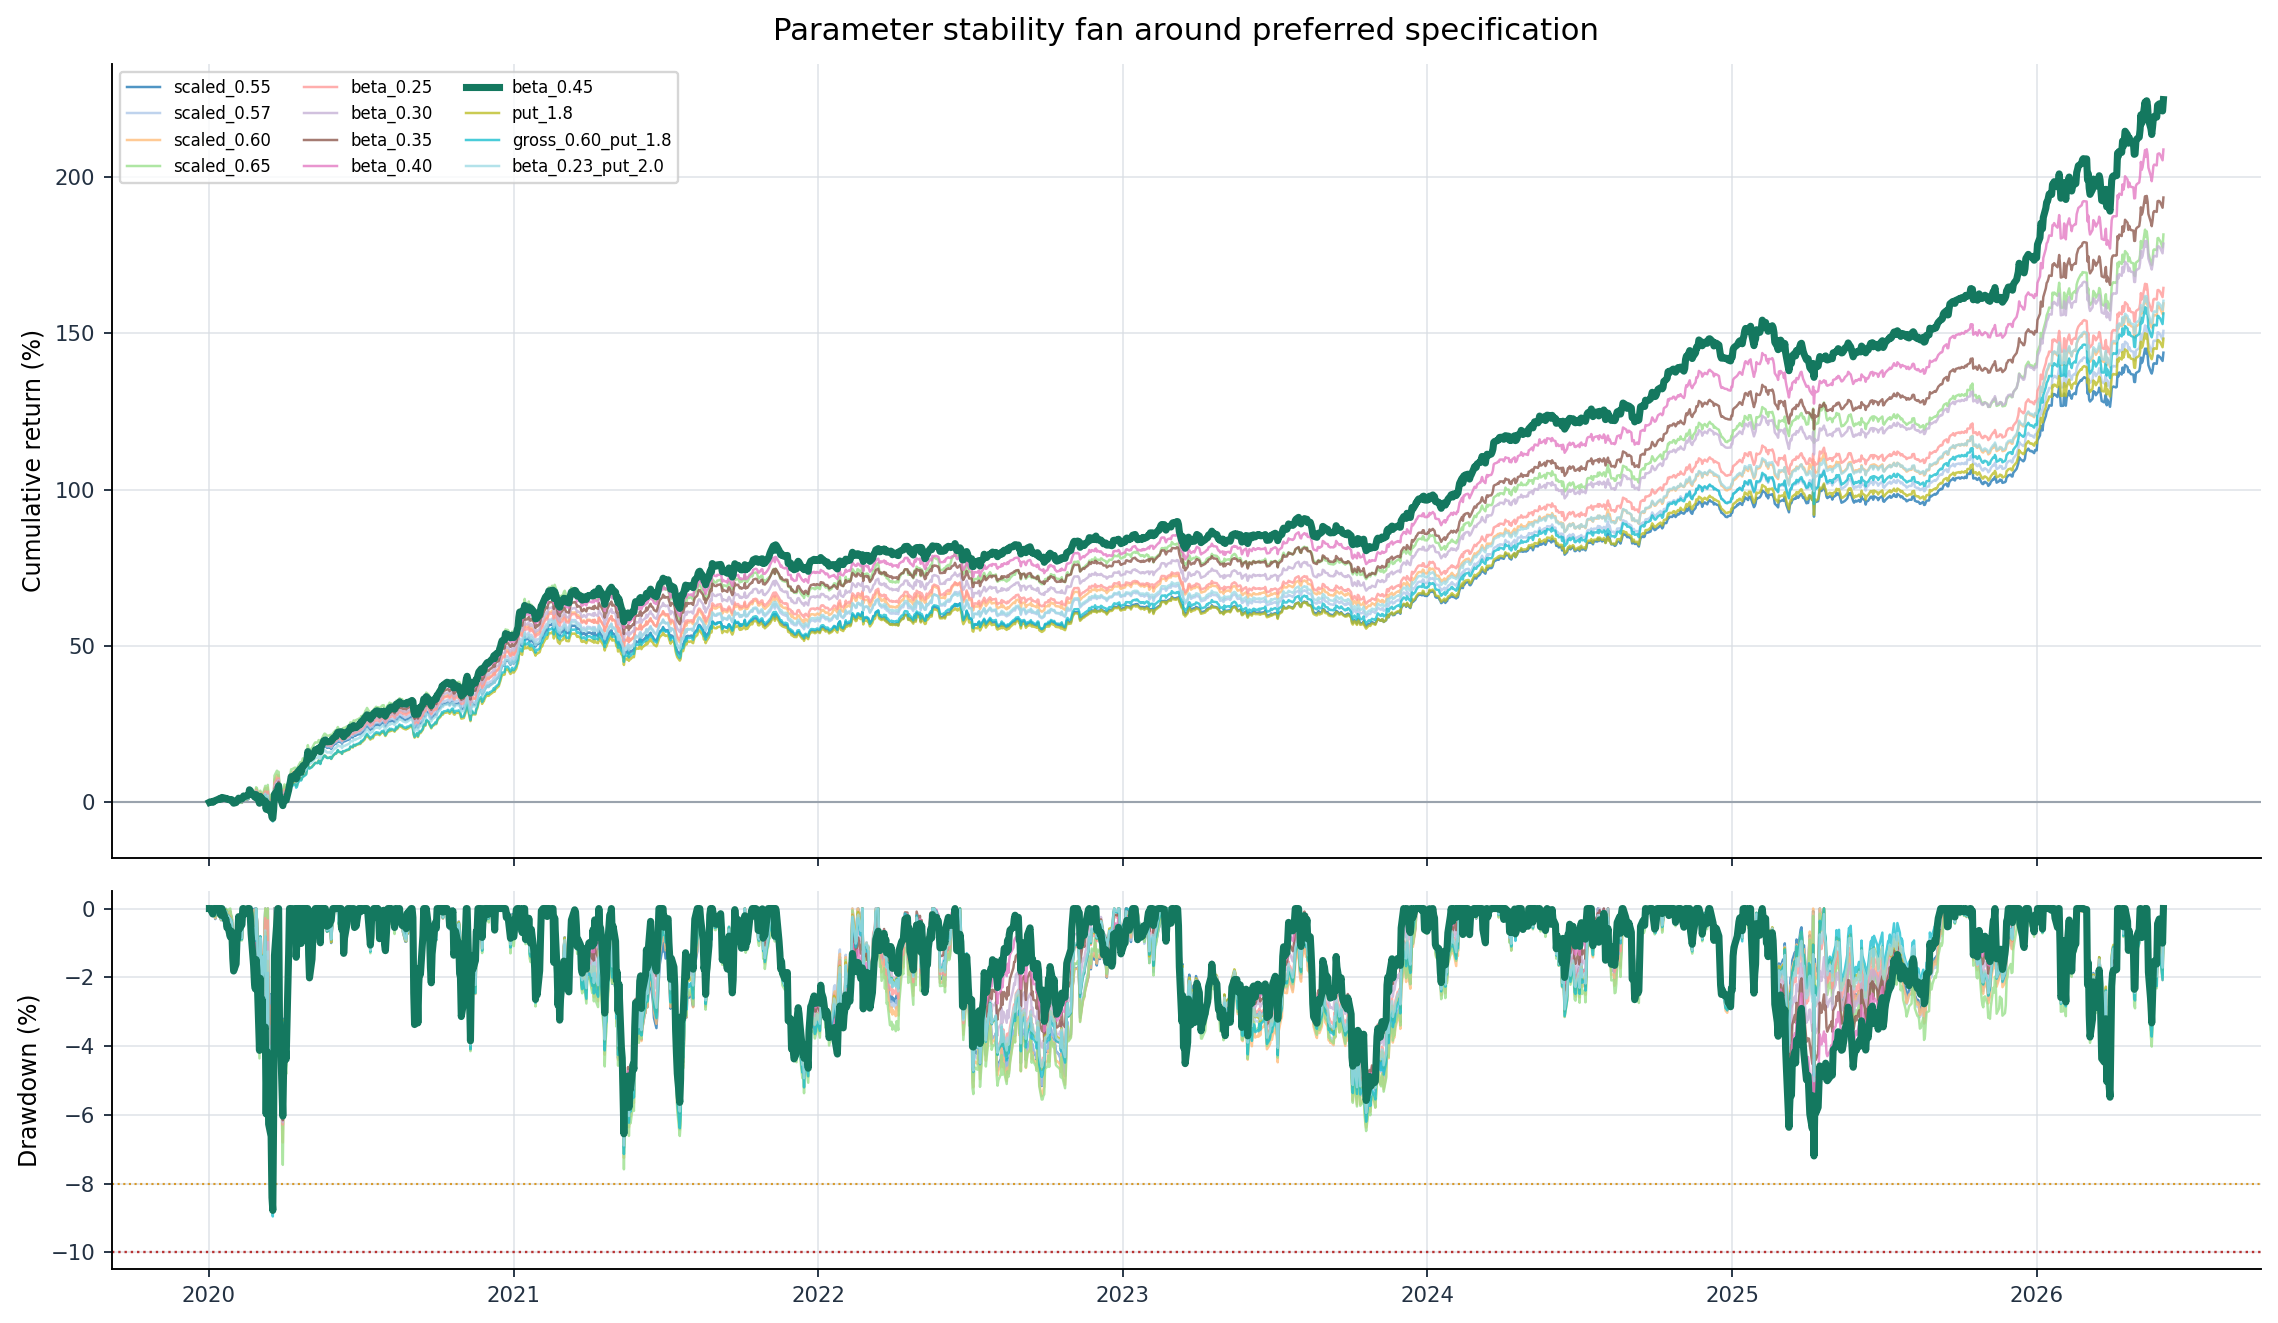
| Best Sharpe specification | 19.4% | 9.4% | 2.06 | -8.8% | 0.48 | 32.0% | Lead research book. Uses more drawdown budget, but remains below the informal -10% danger line. |
| Risk-tight boundary | 18.5% | 9.4% | 1.98 | -7.9% | 0.43 | 32.0% | Tight implementation if the drawdown limit is treated as -8% rather than -10%. |
| Conservative fallback | 17.6% | 9.4% | 1.88 | -7.0% | 0.38 | 32.0% | Lower-beta version for capital-ramp or conservative implementation framing. |
Historical research output only. Figures are not live performance, target returns, investment advice, an offer, solicitation, or a recommendation.
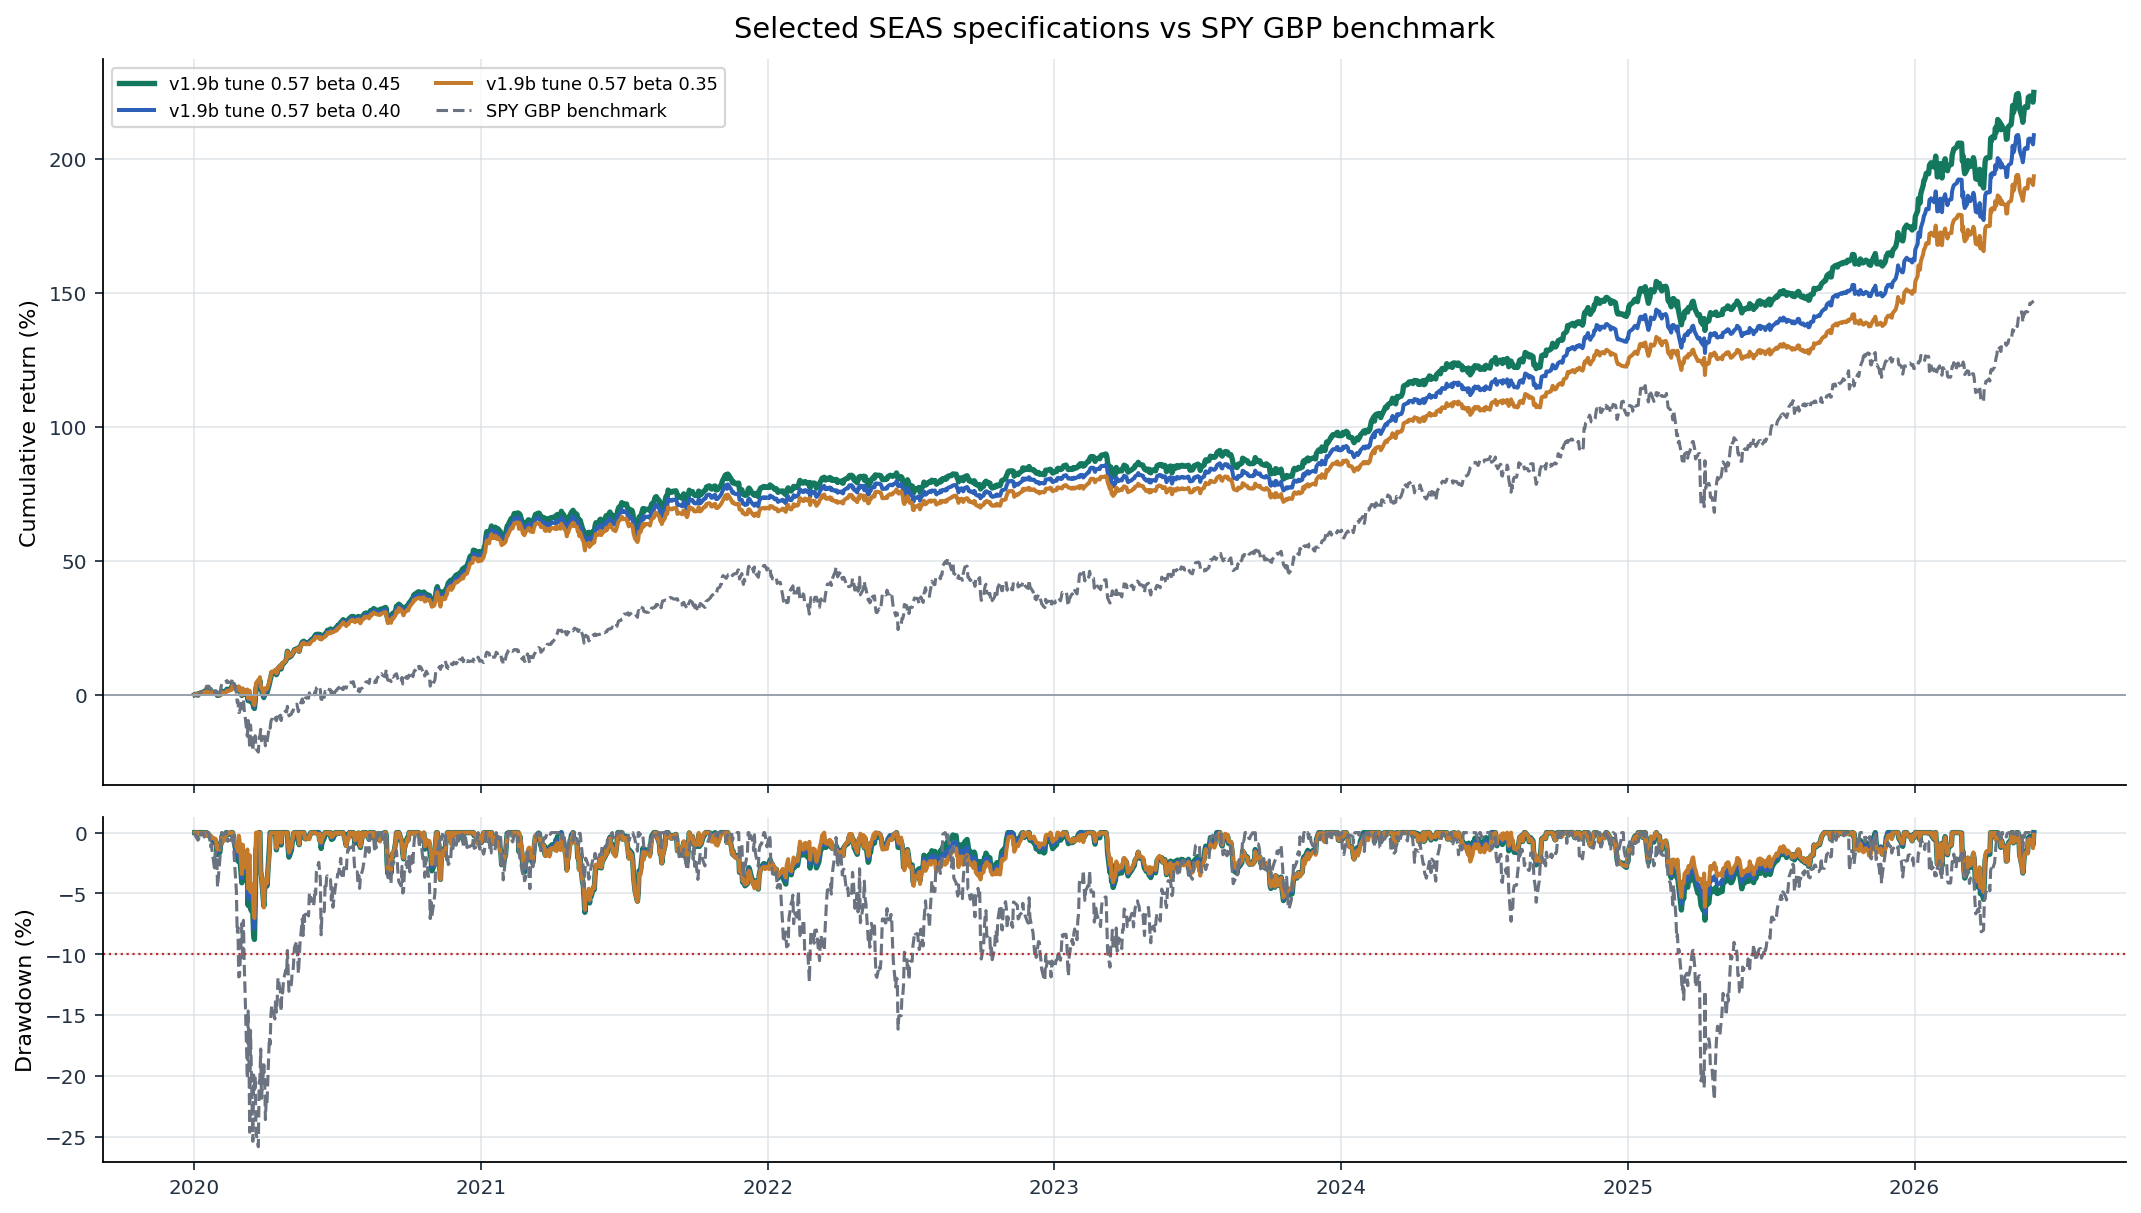
Against SPY in unhedged GBP terms over 2020-01-02 to 2026-06-02:
| Variant | Ann. return | SPY ann. return | Annualised outperformance | Total return | SPY total return | Total outperformance |
|---|---|---|---|---|---|---|
beta045 Best Sharpe |
19.4% | 14.6% | +4.8% p.a. | 224.4% | 146.8% | +77.6 pp |
beta040 risk-tight |
18.5% | 14.6% | +3.9% p.a. | 208.5% | 146.8% | +61.6 pp |
beta035 conservative |
17.6% | 14.6% | +3.0% p.a. | 193.1% | 146.8% | +46.3 pp |
Report figures
Implementation diagnostics
Professional review